Sea Surface Altimetry Data Analysis
For this example we will use gridded sea-surface altimetry data from The Copernicus Marine Environment. This is a widely used dataset in physical oceanography and climate.
The dataset has been extracted from Copernicus and stored in google cloud storage in xarray-zarr format. It is catalogues in the Pangeo Cloud Catalog at https://catalog.pangeo.io/browse/master/ocean/sea_surface_height/
[1]:
import numpy as np
import xarray as xr
import matplotlib.pyplot as plt
import hvplot.xarray
plt.rcParams['figure.figsize'] = (15,10)
%matplotlib inline
Initialize Dataset
Here we load the dataset from the zarr store. Note that this very large dataset initializes nearly instantly, and we can see the full list of variables and coordinates, including metadata for each variable.
[2]:
from intake import open_catalog
cat = open_catalog("https://raw.githubusercontent.com/pangeo-data/pangeo-datastore/master/intake-catalogs/ocean.yaml")
ds = cat["sea_surface_height"].to_dask()
ds
[2]:
<xarray.Dataset>
Dimensions: (time: 8901, latitude: 720, longitude: 1440, nv: 2)
Coordinates:
crs int32 ...
lat_bnds (time, latitude, nv) float32 dask.array<chunksize=(5, 720, 2), meta=np.ndarray>
* latitude (latitude) float32 -89.88 -89.62 -89.38 ... 89.38 89.62 89.88
lon_bnds (longitude, nv) float32 dask.array<chunksize=(1440, 2), meta=np.ndarray>
* longitude (longitude) float32 0.125 0.375 0.625 0.875 ... 359.4 359.6 359.9
* nv (nv) int32 0 1
* time (time) datetime64[ns] 1993-01-01 1993-01-02 ... 2017-05-15
Data variables:
adt (time, latitude, longitude) float64 dask.array<chunksize=(5, 720, 1440), meta=np.ndarray>
err (time, latitude, longitude) float64 dask.array<chunksize=(5, 720, 1440), meta=np.ndarray>
sla (time, latitude, longitude) float64 dask.array<chunksize=(5, 720, 1440), meta=np.ndarray>
ugos (time, latitude, longitude) float64 dask.array<chunksize=(5, 720, 1440), meta=np.ndarray>
ugosa (time, latitude, longitude) float64 dask.array<chunksize=(5, 720, 1440), meta=np.ndarray>
vgos (time, latitude, longitude) float64 dask.array<chunksize=(5, 720, 1440), meta=np.ndarray>
vgosa (time, latitude, longitude) float64 dask.array<chunksize=(5, 720, 1440), meta=np.ndarray>
Attributes: (12/43)
Conventions: CF-1.6
Metadata_Conventions: Unidata Dataset Discovery v1.0
cdm_data_type: Grid
comment: Sea Surface Height measured by Altimetry...
contact: servicedesk.cmems@mercator-ocean.eu
creator_email: servicedesk.cmems@mercator-ocean.eu
... ...
summary: SSALTO/DUACS Delayed-Time Level-4 sea su...
time_coverage_duration: P1D
time_coverage_end: 1993-01-01T12:00:00Z
time_coverage_resolution: P1D
time_coverage_start: 1992-12-31T12:00:00Z
title: DT merged all satellites Global Ocean Gr...- time: 8901
- latitude: 720
- longitude: 1440
- nv: 2
- crs()int32...
- comment :
- This is a container variable that describes the grid_mapping used by the data in this file. This variable does not contain any data; only information about the geographic coordinate system.
- grid_mapping_name :
- latitude_longitude
- inverse_flattening :
- 298.257
- semi_major_axis :
- 6378136.3
array(-2147483647, dtype=int32)
- lat_bnds(time, latitude, nv)float32dask.array<chunksize=(5, 720, 2), meta=np.ndarray>
- comment :
- latitude values at the north and south bounds of each pixel.
- units :
- degrees_north
Array Chunk Bytes 48.89 MiB 28.12 kiB Shape (8901, 720, 2) (5, 720, 2) Count 1782 Tasks 1781 Chunks Type float32 numpy.ndarray - latitude(latitude)float32-89.88 -89.62 ... 89.62 89.88
- axis :
- Y
- bounds :
- lat_bnds
- long_name :
- Latitude
- standard_name :
- latitude
- units :
- degrees_north
- valid_max :
- 89.875
- valid_min :
- -89.875
array([-89.875, -89.625, -89.375, ..., 89.375, 89.625, 89.875], dtype=float32) - lon_bnds(longitude, nv)float32dask.array<chunksize=(1440, 2), meta=np.ndarray>
- comment :
- longitude values at the west and east bounds of each pixel.
- units :
- degrees_east
Array Chunk Bytes 11.25 kiB 11.25 kiB Shape (1440, 2) (1440, 2) Count 2 Tasks 1 Chunks Type float32 numpy.ndarray - longitude(longitude)float320.125 0.375 0.625 ... 359.6 359.9
- axis :
- X
- bounds :
- lon_bnds
- long_name :
- Longitude
- standard_name :
- longitude
- units :
- degrees_east
- valid_max :
- 359.875
- valid_min :
- 0.125
array([1.25000e-01, 3.75000e-01, 6.25000e-01, ..., 3.59375e+02, 3.59625e+02, 3.59875e+02], dtype=float32) - nv(nv)int320 1
- comment :
- Vertex
- units :
- 1
array([0, 1], dtype=int32)
- time(time)datetime64[ns]1993-01-01 ... 2017-05-15
- axis :
- T
- long_name :
- Time
- standard_name :
- time
array(['1993-01-01T00:00:00.000000000', '1993-01-02T00:00:00.000000000', '1993-01-03T00:00:00.000000000', ..., '2017-05-13T00:00:00.000000000', '2017-05-14T00:00:00.000000000', '2017-05-15T00:00:00.000000000'], dtype='datetime64[ns]')
- adt(time, latitude, longitude)float64dask.array<chunksize=(5, 720, 1440), meta=np.ndarray>
- comment :
- The absolute dynamic topography is the sea surface height above geoid; the adt is obtained as follows: adt=sla+mdt where mdt is the mean dynamic topography; see the product user manual for details
- grid_mapping :
- crs
- long_name :
- Absolute dynamic topography
- standard_name :
- sea_surface_height_above_geoid
- units :
- m
Array Chunk Bytes 68.76 GiB 39.55 MiB Shape (8901, 720, 1440) (5, 720, 1440) Count 1782 Tasks 1781 Chunks Type float64 numpy.ndarray - err(time, latitude, longitude)float64dask.array<chunksize=(5, 720, 1440), meta=np.ndarray>
- comment :
- The formal mapping error represents a purely theoretical mapping error. It mainly traduces errors induced by the constellation sampling capability and consistency with the spatial/temporal scales considered, as described in Le Traon et al (1998) or Ducet et al (2000)
- grid_mapping :
- crs
- long_name :
- Formal mapping error
- units :
- m
Array Chunk Bytes 68.76 GiB 39.55 MiB Shape (8901, 720, 1440) (5, 720, 1440) Count 1782 Tasks 1781 Chunks Type float64 numpy.ndarray - sla(time, latitude, longitude)float64dask.array<chunksize=(5, 720, 1440), meta=np.ndarray>
- comment :
- The sea level anomaly is the sea surface height above mean sea surface; it is referenced to the [1993, 2012] period; see the product user manual for details
- grid_mapping :
- crs
- long_name :
- Sea level anomaly
- standard_name :
- sea_surface_height_above_sea_level
- units :
- m
Array Chunk Bytes 68.76 GiB 39.55 MiB Shape (8901, 720, 1440) (5, 720, 1440) Count 1782 Tasks 1781 Chunks Type float64 numpy.ndarray - ugos(time, latitude, longitude)float64dask.array<chunksize=(5, 720, 1440), meta=np.ndarray>
- grid_mapping :
- crs
- long_name :
- Absolute geostrophic velocity: zonal component
- standard_name :
- surface_geostrophic_eastward_sea_water_velocity
- units :
- m/s
Array Chunk Bytes 68.76 GiB 39.55 MiB Shape (8901, 720, 1440) (5, 720, 1440) Count 1782 Tasks 1781 Chunks Type float64 numpy.ndarray - ugosa(time, latitude, longitude)float64dask.array<chunksize=(5, 720, 1440), meta=np.ndarray>
- comment :
- The geostrophic velocity anomalies are referenced to the [1993, 2012] period
- grid_mapping :
- crs
- long_name :
- Geostrophic velocity anomalies: zonal component
- standard_name :
- surface_geostrophic_eastward_sea_water_velocity_assuming_sea_level_for_geoid
- units :
- m/s
Array Chunk Bytes 68.76 GiB 39.55 MiB Shape (8901, 720, 1440) (5, 720, 1440) Count 1782 Tasks 1781 Chunks Type float64 numpy.ndarray - vgos(time, latitude, longitude)float64dask.array<chunksize=(5, 720, 1440), meta=np.ndarray>
- grid_mapping :
- crs
- long_name :
- Absolute geostrophic velocity: meridian component
- standard_name :
- surface_geostrophic_northward_sea_water_velocity
- units :
- m/s
Array Chunk Bytes 68.76 GiB 39.55 MiB Shape (8901, 720, 1440) (5, 720, 1440) Count 1782 Tasks 1781 Chunks Type float64 numpy.ndarray - vgosa(time, latitude, longitude)float64dask.array<chunksize=(5, 720, 1440), meta=np.ndarray>
- comment :
- The geostrophic velocity anomalies are referenced to the [1993, 2012] period
- grid_mapping :
- crs
- long_name :
- Geostrophic velocity anomalies: meridian component
- standard_name :
- surface_geostrophic_northward_sea_water_velocity_assuming_sea_level_for_geoid
- units :
- m/s
Array Chunk Bytes 68.76 GiB 39.55 MiB Shape (8901, 720, 1440) (5, 720, 1440) Count 1782 Tasks 1781 Chunks Type float64 numpy.ndarray
- Conventions :
- CF-1.6
- Metadata_Conventions :
- Unidata Dataset Discovery v1.0
- cdm_data_type :
- Grid
- comment :
- Sea Surface Height measured by Altimetry and derived variables
- contact :
- servicedesk.cmems@mercator-ocean.eu
- creator_email :
- servicedesk.cmems@mercator-ocean.eu
- creator_name :
- CMEMS - Sea Level Thematic Assembly Center
- creator_url :
- http://marine.copernicus.eu
- date_created :
- 2014-02-26T16:09:13Z
- date_issued :
- 2014-01-06T00:00:00Z
- date_modified :
- 2015-11-10T19:42:51Z
- geospatial_lat_max :
- 89.875
- geospatial_lat_min :
- -89.875
- geospatial_lat_resolution :
- 0.25
- geospatial_lat_units :
- degrees_north
- geospatial_lon_max :
- 359.875
- geospatial_lon_min :
- 0.125
- geospatial_lon_resolution :
- 0.25
- geospatial_lon_units :
- degrees_east
- geospatial_vertical_max :
- 0.0
- geospatial_vertical_min :
- 0.0
- geospatial_vertical_positive :
- down
- geospatial_vertical_resolution :
- point
- geospatial_vertical_units :
- m
- history :
- 2014-02-26T16:09:13Z: created by DUACS DT - 2015-11-10T19:42:51Z: Change of some attributes - 2017-01-06 12:12:12Z: New format for CMEMSv3
- institution :
- CLS, CNES
- keywords :
- Oceans > Ocean Topography > Sea Surface Height
- keywords_vocabulary :
- NetCDF COARDS Climate and Forecast Standard Names
- license :
- http://marine.copernicus.eu/web/27-service-commitments-and-licence.php
- platform :
- ERS-1, Topex/Poseidon
- processing_level :
- L4
- product_version :
- 5.0
- project :
- COPERNICUS MARINE ENVIRONMENT MONITORING SERVICE (CMEMS)
- references :
- http://marine.copernicus.eu
- source :
- Altimetry measurements
- ssalto_duacs_comment :
- The reference mission used for the altimeter inter-calibration processing is Topex/Poseidon between 1993-01-01 and 2002-04-23, Jason-1 between 2002-04-24 and 2008-10-18, OSTM/Jason-2 since 2008-10-19.
- standard_name_vocabulary :
- NetCDF Climate and Forecast (CF) Metadata Convention Standard Name Table v37
- summary :
- SSALTO/DUACS Delayed-Time Level-4 sea surface height and derived variables measured by multi-satellite altimetry observations over Global Ocean.
- time_coverage_duration :
- P1D
- time_coverage_end :
- 1993-01-01T12:00:00Z
- time_coverage_resolution :
- P1D
- time_coverage_start :
- 1992-12-31T12:00:00Z
- title :
- DT merged all satellites Global Ocean Gridded SSALTO/DUACS Sea Surface Height L4 product and derived variables
Visually Examine Some of the Data
Let’s do a sanity check that the data looks reasonable. Here we use the hvplot interactive plotting library.
[3]:
ds.sla.hvplot.image('longitude', 'latitude',
rasterize=True, dynamic=True, width=800, height=450,
widget_type='scrubber', widget_location='bottom', cmap='RdBu_r')
[3]:
Create and Connect to Dask Distributed Cluster
[4]:
from dask_gateway import Gateway
from dask.distributed import Client
gateway = Gateway()
cluster = gateway.new_cluster()
cluster.adapt(minimum=1, maximum=20)
cluster
/srv/conda/envs/notebook/lib/python3.9/site-packages/dask_gateway/client.py:21: FutureWarning: format_bytes is deprecated and will be removed in a future release. Please use dask.utils.format_bytes instead.
from distributed.utils import LoopRunner, format_bytes
** ☝️ Don’t forget to click the link above to view the scheduler dashboard! **
[5]:
client = Client(cluster)
client
[5]:
Client
Client-3b1fefba-3288-11ec-8150-d16c251fb315
| Connection method: Cluster object | Cluster type: dask_gateway.GatewayCluster |
| Dashboard: https://hub.binder.pangeo.io/services/dask-gateway/clusters/prod.23faa3a4735f4e74a35199bba69755b5/status |
Cluster Info
GatewayCluster
- Name: prod.23faa3a4735f4e74a35199bba69755b5
- Dashboard: https://hub.binder.pangeo.io/services/dask-gateway/clusters/prod.23faa3a4735f4e74a35199bba69755b5/status
Timeseries of Global Mean Sea Level
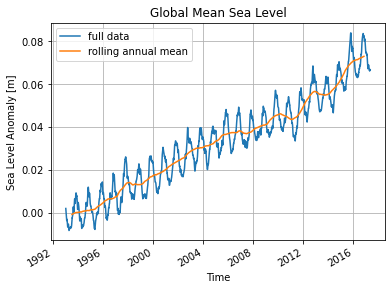
Here we make a simple yet fundamental calculation: the rate of increase of global mean sea level over the observational period.
[6]:
# the number of GB involved in the reduction
ds.sla.nbytes/1e9
[6]:
73.8284544
[7]:
# the computationally intensive step
sla_timeseries = ds.sla.mean(dim=('latitude', 'longitude')).load()
[8]:
sla_timeseries.plot(label='full data')
sla_timeseries.rolling(time=365, center=True).mean().plot(label='rolling annual mean')
plt.ylabel('Sea Level Anomaly [m]')
plt.title('Global Mean Sea Level')
plt.legend()
plt.grid()
In order to understand how the sea level rise is distributed in latitude, we can make a sort of Hovmöller diagram.
[9]:
sla_hov = ds.sla.mean(dim='longitude').load()
[10]:
fig, ax = plt.subplots(figsize=(12, 4))
sla_hov.name = 'Sea Level Anomaly [m]'
sla_hov.transpose().plot(vmax=0.2, ax=ax)
[10]:
<matplotlib.collections.QuadMesh at 0x7f3b55185400>
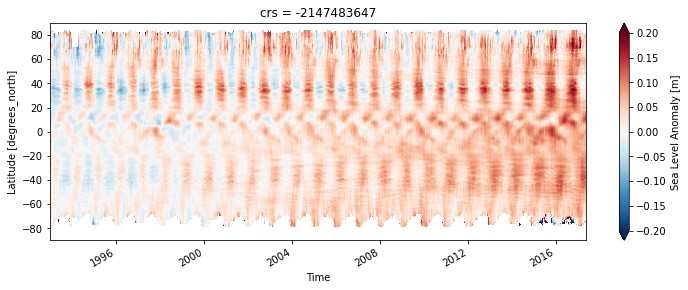
We can see that most sea level rise is actually in the Southern Hemisphere.
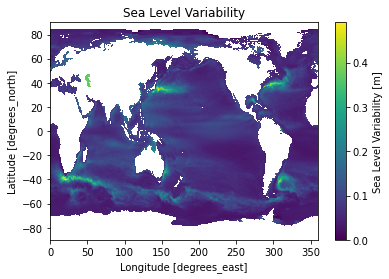
Sea Level Variability
We can examine the natural variability in sea level by looking at its standard deviation in time.
[11]:
sla_std = ds.sla.std(dim='time').load()
sla_std.name = 'Sea Level Variability [m]'
[12]:
ax = sla_std.plot()
_ = plt.title('Sea Level Variability')