
Global Mean Surface Temperature
This notebook uses similar techniques to ECS_Gregory_method.ipynb. Please refer to that notebook for details.
[1]:
from matplotlib import pyplot as plt
import xarray as xr
import numpy as np
import dask
from dask.diagnostics import progress
from tqdm.autonotebook import tqdm
import intake
import fsspec
import seaborn as sns

%matplotlib inline
%config InlineBackend.figure_format = 'retina'
/srv/conda/envs/notebook/lib/python3.7/site-packages/ipykernel_launcher.py:6: TqdmExperimentalWarning: Using `tqdm.autonotebook.tqdm` in notebook mode. Use `tqdm.tqdm` instead to force console mode (e.g. in jupyter console)
[2]:
col = intake.open_esm_datastore("https://storage.googleapis.com/cmip6/pangeo-cmip6.json")
col
/srv/conda/envs/notebook/lib/python3.7/site-packages/IPython/core/interactiveshell.py:3417: DtypeWarning: Columns (10) have mixed types.Specify dtype option on import or set low_memory=False.
  exec(code_obj, self.user_global_ns, self.user_ns)
pangeo-cmip6 catalog with 4749 dataset(s) from 294376 asset(s):
| unique | |
|---|---|
| activity_id | 15 |
| institution_id | 34 |
| source_id | 79 |
| experiment_id | 107 |
| member_id | 213 |
| table_id | 30 |
| variable_id | 392 |
| grid_label | 10 |
| zstore | 294376 |
| dcpp_init_year | 60 |
| version | 529 |
[3]:
[eid for eid in col.df['experiment_id'].unique() if 'ssp' in eid]
[3]:
['ssp370',
 'esm-ssp585',
 'ssp126',
 'ssp245',
 'ssp585',
 'ssp245-GHG',
 'ssp245-aer',
 'ssp245-nat',
 'ssp245-stratO3',
 'esm-ssp585-ssp126Lu',
 'ssp119',
 'ssp434',
 'ssp460',
 'ssp534-over']
[4]:
# there is currently a significant amount of data for these runs
expts = ['historical', 'ssp245', 'ssp585']

query = dict(
    experiment_id=expts,
    table_id='Amon',
    variable_id=['tas'],
    member_id = 'r1i1p1f1',
)

col_subset = col.search(require_all_on=["source_id"], **query)
col_subset.df.groupby("source_id")[
    ["experiment_id", "variable_id", "table_id"]
].nunique()
[4]:
| experiment_id | variable_id | table_id | |
|---|---|---|---|
| source_id | |||
| ACCESS-CM2 | 3 | 1 | 1 |
| ACCESS-ESM1-5 | 3 | 1 | 1 |
| AWI-CM-1-1-MR | 3 | 1 | 1 |
| BCC-CSM2-MR | 3 | 1 | 1 |
| CAMS-CSM1-0 | 3 | 1 | 1 |
| CESM2-WACCM | 3 | 1 | 1 |
| CIESM | 3 | 1 | 1 |
| CMCC-CM2-SR5 | 3 | 1 | 1 |
| CanESM5 | 3 | 1 | 1 |
| EC-Earth3 | 3 | 1 | 1 |
| EC-Earth3-Veg | 3 | 1 | 1 |
| FGOALS-f3-L | 3 | 1 | 1 |
| FGOALS-g3 | 3 | 1 | 1 |
| FIO-ESM-2-0 | 3 | 1 | 1 |
| GFDL-CM4 | 3 | 1 | 1 |
| GFDL-ESM4 | 3 | 1 | 1 |
| IITM-ESM | 3 | 1 | 1 |
| INM-CM4-8 | 3 | 1 | 1 |
| INM-CM5-0 | 3 | 1 | 1 |
| IPSL-CM6A-LR | 3 | 1 | 1 |
| KACE-1-0-G | 3 | 1 | 1 |
| KIOST-ESM | 3 | 1 | 1 |
| MIROC6 | 3 | 1 | 1 |
| MPI-ESM1-2-HR | 3 | 1 | 1 |
| MPI-ESM1-2-LR | 3 | 1 | 1 |
| MRI-ESM2-0 | 3 | 1 | 1 |
| NESM3 | 3 | 1 | 1 |
| NorESM2-LM | 3 | 1 | 1 |
| NorESM2-MM | 3 | 1 | 1 |
[5]:
def drop_all_bounds(ds):
    drop_vars = [vname for vname in ds.coords
                 if (('_bounds') in vname ) or ('_bnds') in vname]
    return ds.drop(drop_vars)

def open_dset(df):
    assert len(df) == 1
    ds = xr.open_zarr(fsspec.get_mapper(df.zstore.values[0]), consolidated=True)
    return drop_all_bounds(ds)

def open_delayed(df):
    return dask.delayed(open_dset)(df)

from collections import defaultdict
dsets = defaultdict(dict)

for group, df in col_subset.df.groupby(by=['source_id', 'experiment_id']):
    dsets[group[0]][group[1]] = open_delayed(df)
[6]:
dsets_ = dask.compute(dict(dsets))[0]
[7]:
# calculate global means

def get_lat_name(ds):
    for lat_name in ['lat', 'latitude']:
        if lat_name in ds.coords:
            return lat_name
    raise RuntimeError("Couldn't find a latitude coordinate")

def global_mean(ds):
    lat = ds[get_lat_name(ds)]
    weight = np.cos(np.deg2rad(lat))
    weight /= weight.mean()
    other_dims = set(ds.dims) - {'time'}
    return (ds * weight).mean(other_dims)
[8]:
expt_da = xr.DataArray(expts, dims='experiment_id', name='experiment_id',
                       coords={'experiment_id': expts})

dsets_aligned = {}

for k, v in tqdm(dsets_.items()):
    expt_dsets = v.values()
    if any([d is None for d in expt_dsets]):
        print(f"Missing experiment for {k}")
        continue

    for ds in expt_dsets:
        ds.coords['year'] = ds.time.dt.year

    # workaround for
    # https://github.com/pydata/xarray/issues/2237#issuecomment-620961663
    dsets_ann_mean = [v[expt].pipe(global_mean)
                             .swap_dims({'time': 'year'})
                             .drop('time')
                             .coarsen(year=12).mean()
                      for expt in expts]

    # align everything with the 4xCO2 experiment
    dsets_aligned[k] = xr.concat(dsets_ann_mean, join='outer',
                                 dim=expt_da)
[9]:
with progress.ProgressBar():
    dsets_aligned_ = dask.compute(dsets_aligned)[0]
[########################################] | 100% Completed | 1min 30.9s
[10]:
source_ids = list(dsets_aligned_.keys())
source_da = xr.DataArray(source_ids, dims='source_id', name='source_id',
                         coords={'source_id': source_ids})

big_ds = xr.concat([ds.reset_coords(drop=True)
                    for ds in dsets_aligned_.values()],
                    dim=source_da)

big_ds
[10]:
<xarray.Dataset>
Dimensions:        (experiment_id: 3, source_id: 29, year: 451)
Coordinates:
  * source_id      (source_id) <U13 'ACCESS-CM2' ... 'NorESM2-MM'
  * year           (year) float64 1.85e+03 1.851e+03 ... 2.299e+03 2.3e+03
  * experiment_id  (experiment_id) <U10 'historical' 'ssp245' 'ssp585'
Data variables:
    tas            (source_id, experiment_id, year) float64 287.0 287.0 ... nan
xarray.Dataset
- experiment_id: 3
- source_id: 29
- year: 451
- source_id(source_id)<U13'ACCESS-CM2' ... 'NorESM2-MM'
array(['ACCESS-CM2', 'ACCESS-ESM1-5', 'AWI-CM-1-1-MR', 'BCC-CSM2-MR', 'CAMS-CSM1-0', 'CESM2-WACCM', 'CIESM', 'CMCC-CM2-SR5', 'CanESM5', 'EC-Earth3', 'EC-Earth3-Veg', 'FGOALS-f3-L', 'FGOALS-g3', 'FIO-ESM-2-0', 'GFDL-CM4', 'GFDL-ESM4', 'IITM-ESM', 'INM-CM4-8', 'INM-CM5-0', 'IPSL-CM6A-LR', 'KACE-1-0-G', 'KIOST-ESM', 'MIROC6', 'MPI-ESM1-2-HR', 'MPI-ESM1-2-LR', 'MRI-ESM2-0', 'NESM3', 'NorESM2-LM', 'NorESM2-MM'], dtype='<U13') - year(year)float641.85e+03 1.851e+03 ... 2.3e+03
array([1850., 1851., 1852., ..., 2298., 2299., 2300.])
- experiment_id(experiment_id)<U10'historical' 'ssp245' 'ssp585'
array(['historical', 'ssp245', 'ssp585'], dtype='<U10')
- tas(source_id, experiment_id, year)float64287.0 287.0 287.2 ... nan nan nan
array([[[287.00749364, 287.01698452, 287.17454216, ...,          nan,
                  nan,          nan],
        [         nan,          nan,          nan, ...,          nan,
                  nan,          nan],
        [         nan,          nan,          nan, ...,          nan,
                  nan,          nan]],

       [[287.78735509, 287.66659835, 287.60427076, ...,          nan,
                  nan,          nan],
        [         nan,          nan,          nan, ...,          nan,
                  nan,          nan],
        [         nan,          nan,          nan, ...,          nan,
                  nan,          nan]],

       [[         nan, 286.82136175, 286.83013242, ...,          nan,
                  nan,          nan],
        [         nan,          nan,          nan, ...,          nan,
                  nan,          nan],
        [         nan,          nan,          nan, ...,          nan,
                  nan,          nan]],
...
       [[286.75054527, 286.8976191 , 286.81241996, ...,          nan,
                  nan,          nan],
        [         nan,          nan,          nan, ...,          nan,
                  nan,          nan],
        [         nan,          nan,          nan, ...,          nan,
                  nan,          nan]],

       [[287.58305201, 287.80131659, 287.70510569, ...,          nan,
                  nan,          nan],
        [         nan,          nan,          nan, ...,          nan,
                  nan,          nan],
        [         nan,          nan,          nan, ...,          nan,
                  nan,          nan]],

       [[287.14579909, 287.16514246, 287.06030532, ...,          nan,
                  nan,          nan],
        [         nan,          nan,          nan, ...,          nan,
                  nan,          nan],
        [         nan,          nan,          nan, ...,          nan,
                  nan,          nan]]])
[11]:
df_all = big_ds.sel(year=slice(1900, 2100)).to_dataframe().reset_index()
df_all.head()
[11]:
| experiment_id | source_id | year | tas | |
|---|---|---|---|---|
| 0 | historical | ACCESS-CM2 | 1900.0 | 287.019917 |
| 1 | historical | ACCESS-CM2 | 1901.0 | 286.966182 |
| 2 | historical | ACCESS-CM2 | 1902.0 | 286.994328 |
| 3 | historical | ACCESS-CM2 | 1903.0 | 286.797043 |
| 4 | historical | ACCESS-CM2 | 1904.0 | 286.803313 |
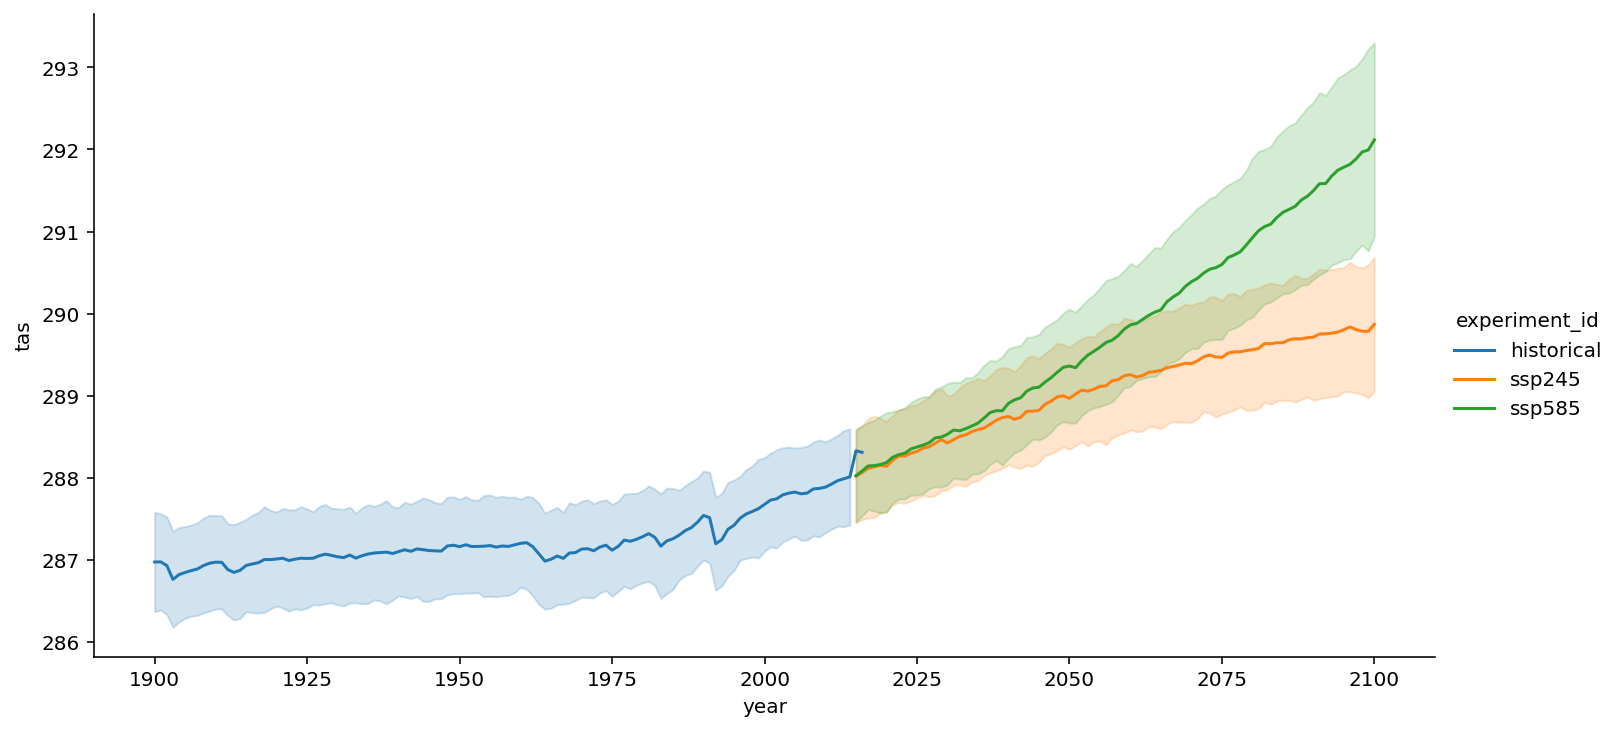
[12]:
sns.relplot(data=df_all,
            x="year", y="tas", hue='experiment_id',
            kind="line", ci="sd", aspect=2);
[12]:
<seaborn.axisgrid.FacetGrid at 0x7faa8e635d50>
[13]:
# why are there axis legends for 9, 10 - doesn't make sense
df_all.experiment_id.unique()
[13]:
array(['historical', 'ssp245', 'ssp585'], dtype=object)